Gantt Charts
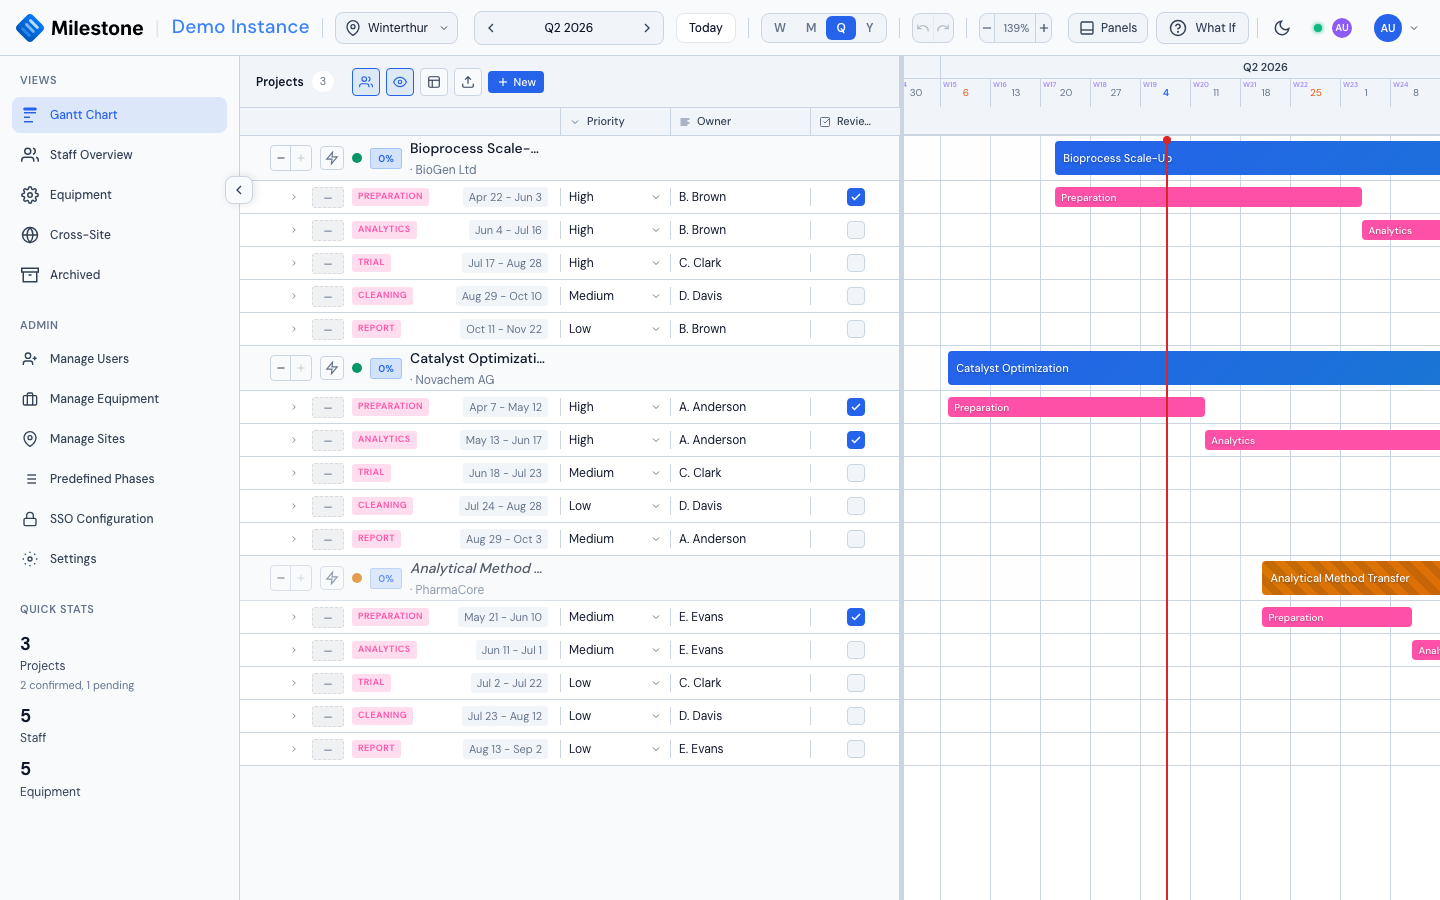
The Gantt Chart is the primary view and the default when you log in. It combines a hierarchical project list with an interactive timeline.
Project Panel
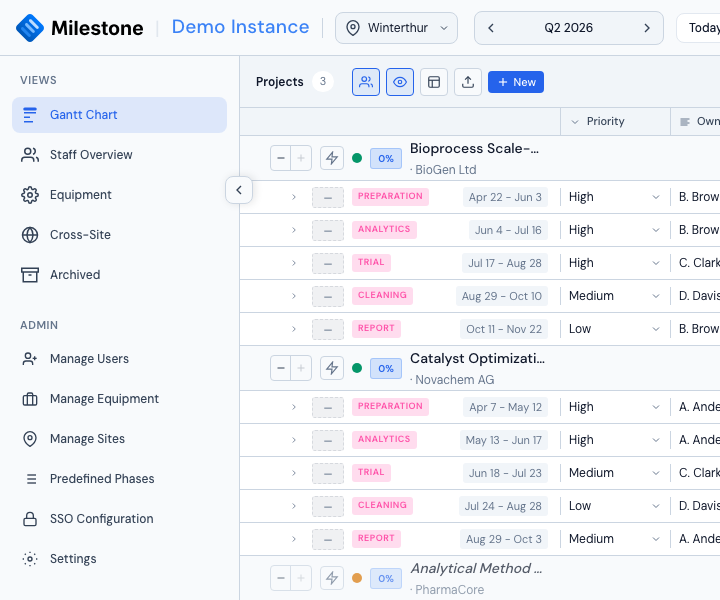
The left panel displays your projects in a tree structure. The header buttons sit at the right edge of the panel, after any custom columns:
- Staff & Equipment — Show or hide the assignment rows
- Tags — Filter projects by tag
- Group by — Group projects by a tag group (shown once tag groups exist)
- Colour by — Colour the project bars by a tag group (shown once tag groups exist)
- Column Visibility — Show or hide custom columns
- + New Project — Create a new project
- Import — Import from CSV, XML, or MPP
- Manage Columns — Configure custom data columns
- Expand/collapse projects to see phases, subphases, and assignments
- Status indicators: confirmed (green) or unconfirmed (gray)
The panel is resizable — drag the divider between the panel and timeline to adjust width (200px to 600px).
Timeline
The right side shows horizontal bars representing duration of each project, phase, and subphase:
- Project bars span the full project duration
- Phase bars are color-coded by phase type
- Subphase bars support unlimited nesting depth
- A red vertical line marks today's date, and the current month is highlighted in the header
- Week numbers follow ISO 8601: weeks start on Monday and week 1 is the week containing the first Thursday of the year, so 1–3 January 2027 show as week 53 (of 2026)
- The timeline opens centred on today in every view
- Bank holidays and company events are highlighted on the background; a company event marked as a site closure gets a stronger, hatched tint (tooltip Site closed: <name>)
- Staff assignment bars are marked on days the person is away — an unavailable absence, or a closure of one of their sites
Resource Panels
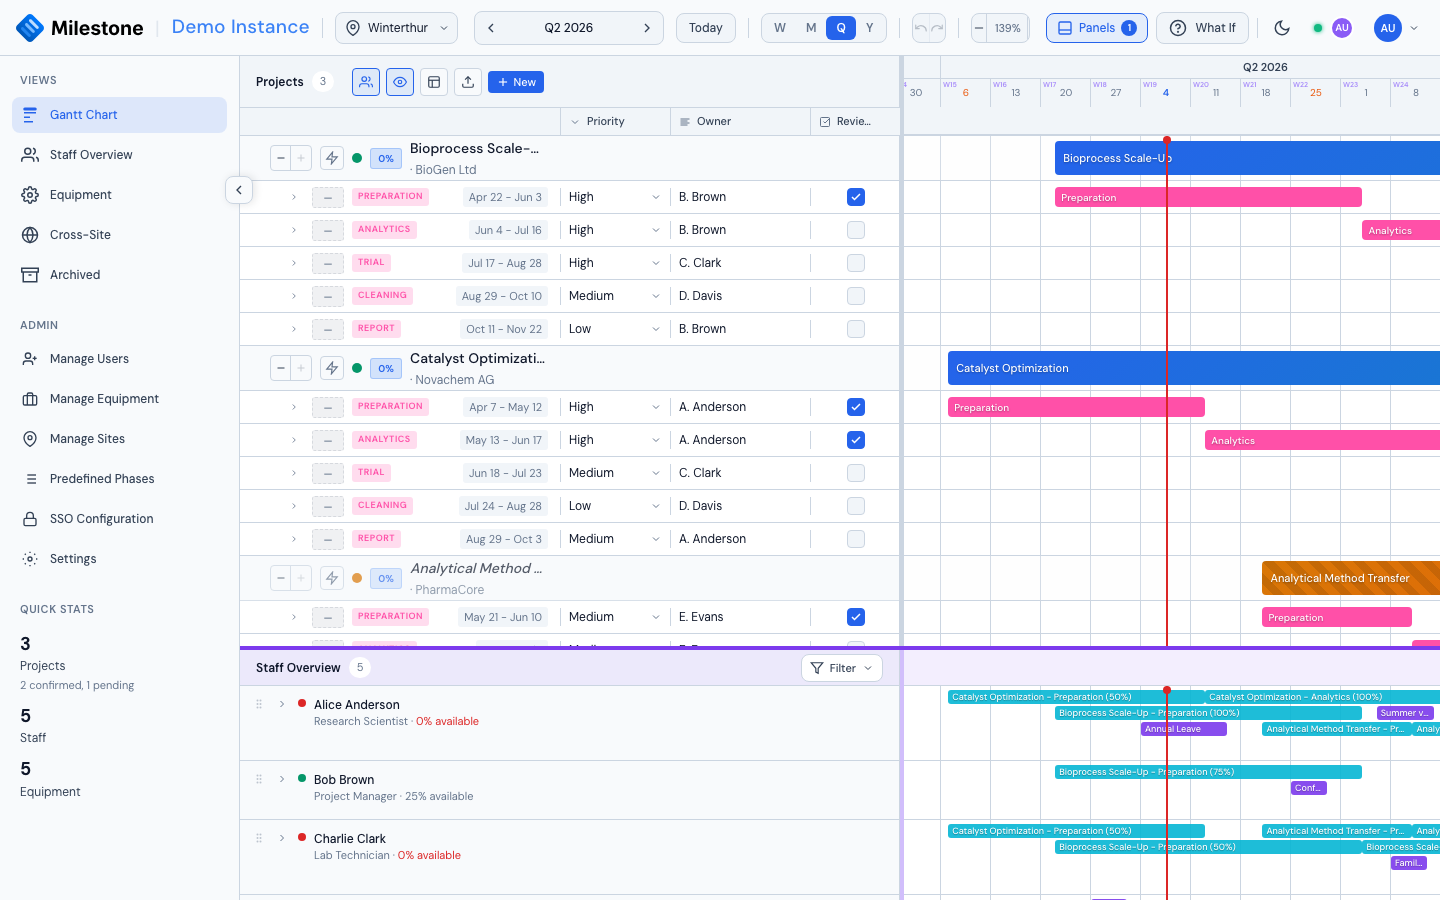
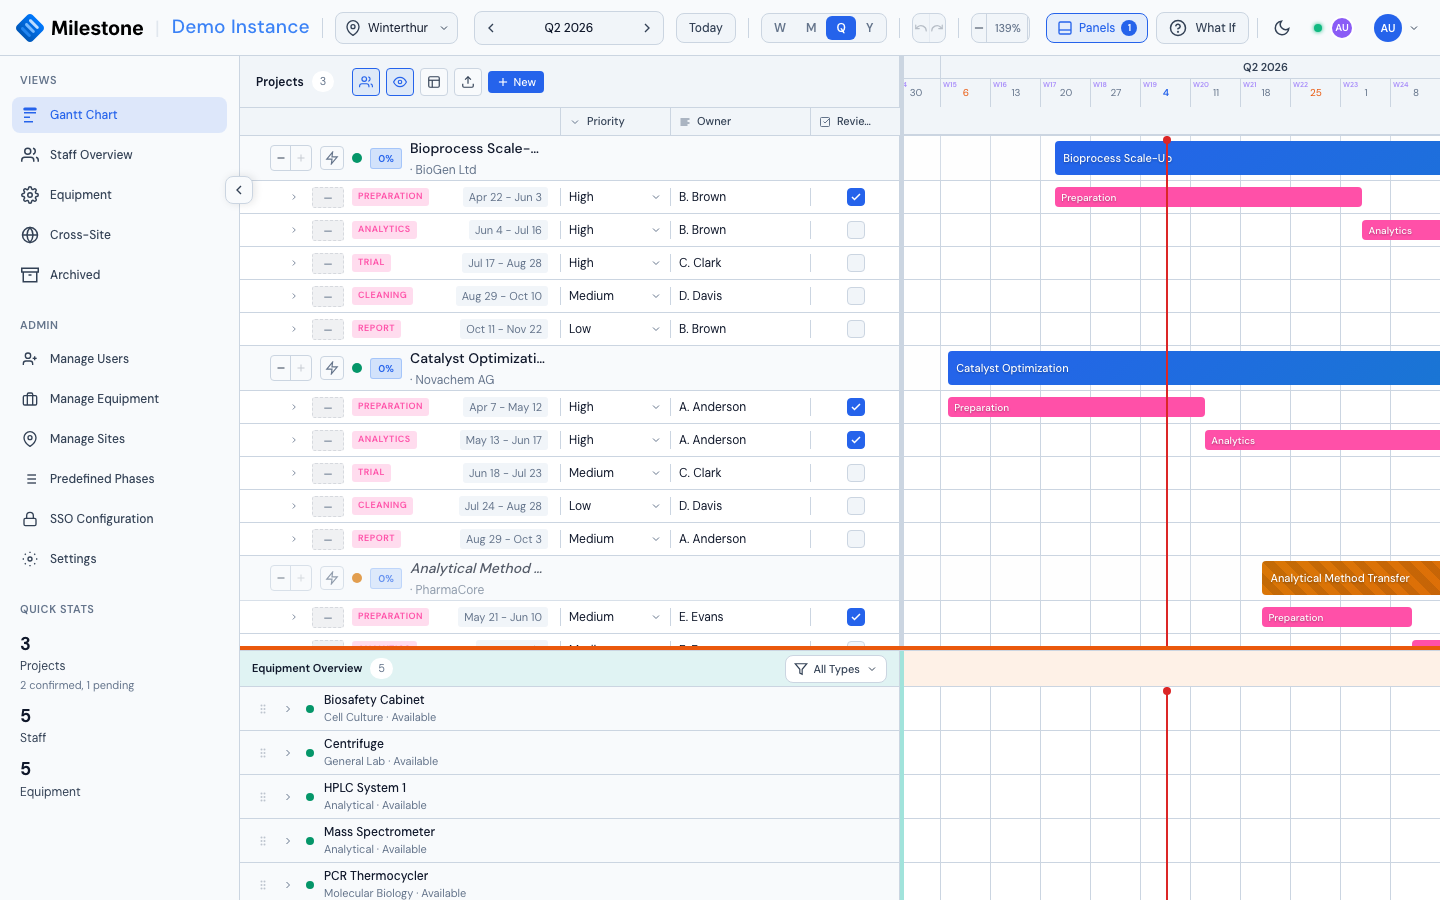
Administrators, superusers and project managers (users who manage at least one project) can dock the Staff Overview or Equipment view directly below the Gantt chart from the Panels button in the header. The two panels are mutually exclusive — you can show one at a time. Drag the divider between the chart and the docked panel to resize each region.
This is the fastest way to see scheduling and capacity together: changes you make in the Gantt are reflected in the panel below in real time.
Who Can Edit a Project
| Admin / Superuser | Project manager | Everyone else | |
|---|---|---|---|
| View the project | Yes | Yes | Yes |
| Create a project, import a project | Yes | No | No |
| Edit details, dates, tags, archive; hand the project to another manager | Yes | Yes | No |
| Add, edit, move, resize, reorder and delete phases and subphases; dependencies; completion | Yes | Yes | No |
| Assign and edit anyone's staff assignments; book equipment | Yes | Yes | No |
| Add themselves, change or remove their own assignment | Yes | Yes | Yes |
| Delete the project | Yes | No | No |
The project manager is the person selected in the project's Project Manager field. They get these rights on that project only, even with the plain User role — controls they can't use on other projects stay disabled. Changing the Project Manager field hands the rights over to someone else. Moving a Kanban card is also open to the card's assignees (see Kanban Board).
Creating a Project
Creating a project needs the Admin or Superuser role.
- Click + New Project in the panel header
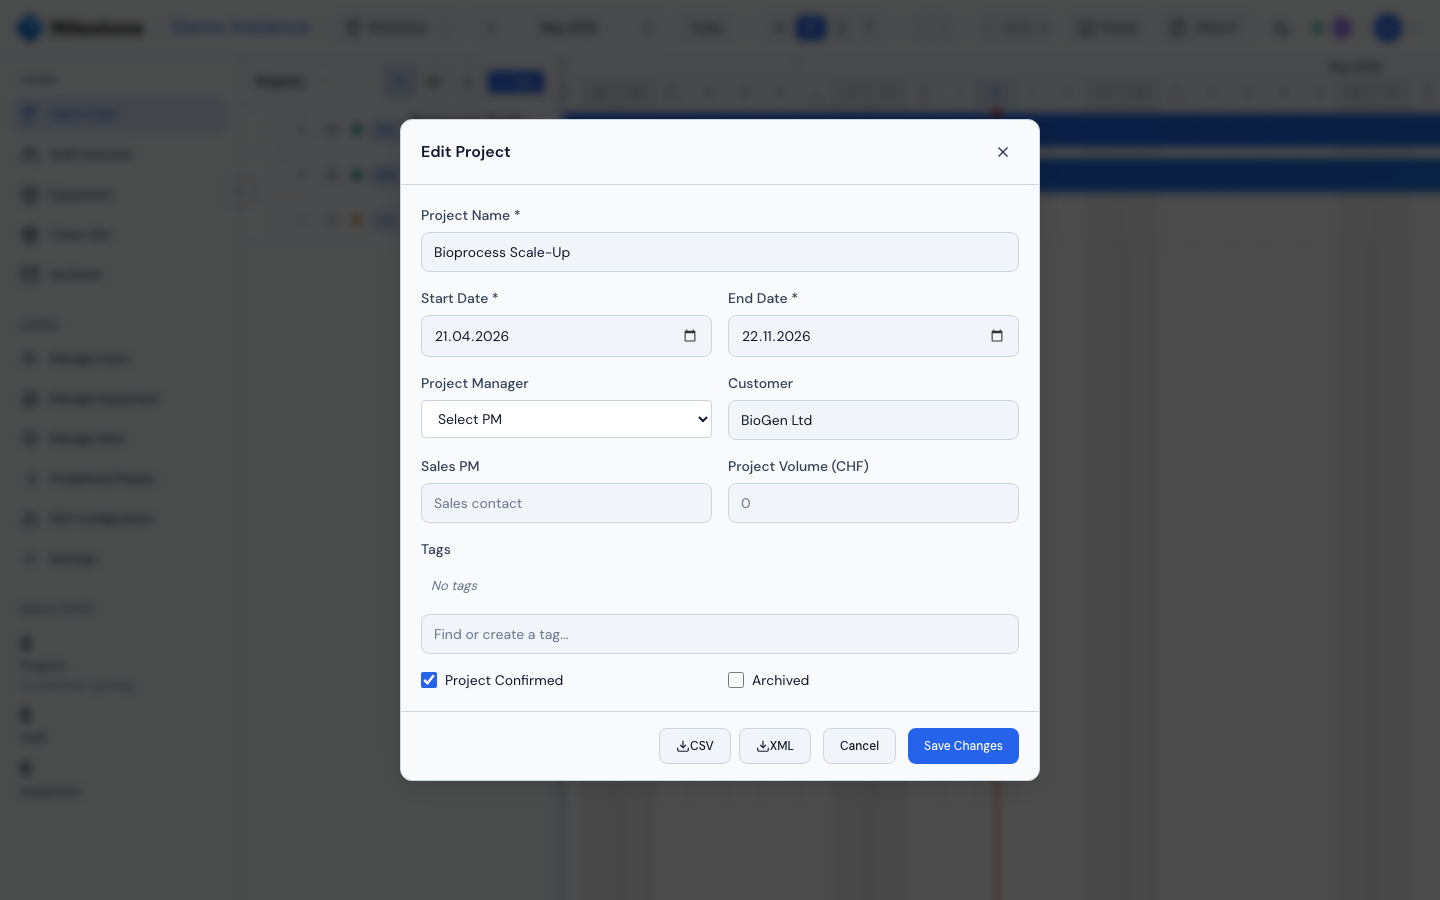
- Fill in required fields: Project Name, Start Date, End Date
- Optionally set: Project Manager, Customer, Sales PM, Project Volume
- Select which predefined phases to include (all active phases are pre-selected)
- Check Project Confirmed if the project is approved
- Click Create Project
Editing Projects, Phases & Subphases
- Edit a project: Click the Edit button or right-click and select "Edit"
- Add a phase: Right-click on a project and select "Add Phase"
- Add a subphase: Right-click on a phase and select "Add Subphase" (supports unlimited nesting)
- Delete: Right-click on any item and select "Delete" (with confirmation). A project manager can delete phases and subphases, but deleting the project itself needs a superuser
When editing a project, export buttons (CSV and XML) are available in the modal footer.
Tags
Tags are coloured labels attached to projects to classify and filter them (e.g. Critical, Internal, Customer). The tag library is shared by the whole workspace: admins define the tags in Settings → Tags (see Tags in Settings), and anyone who can edit a project attaches them.
Tags can be organised into groups such as Project type → Internal / Customer. A single-select group allows one of its tags per project. Each tag applies to all sites or only to the sites an admin picked, so the picker and the filter only offer the tags that apply to the project's site.
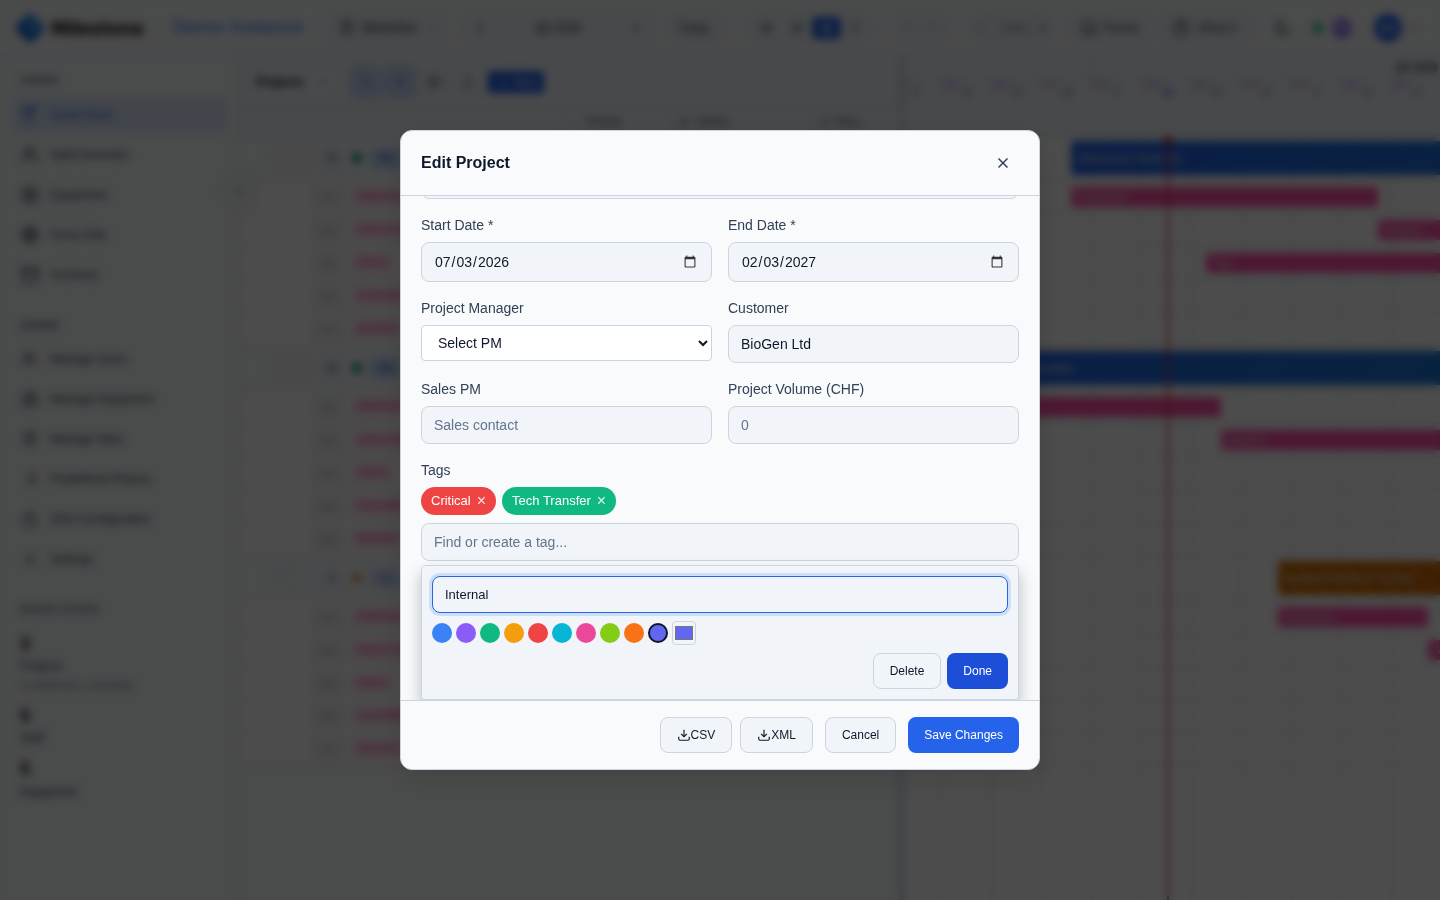
Attaching a tag
- Open the project (Edit, or while creating a new one).
- Click the Tags field. The dropdown lists the available tags by group, with ungrouped tags under Other.
- Start typing to filter, then click a tag (or press Enter on a unique match) to attach it. It appears as a coloured pill above the field. In a single-select group, choosing a tag replaces the one already selected from that group.
- Click the × on a pill to detach the tag.
Admins see a Manage tags… link in the picker that opens Settings → Tags.
Project colours
Each user can colour the project bars by a tag group:
- Click the Colour by button in the project panel header (next to Group by).
- Pick a tag group — any group, single-select or not. Default returns to the standard bar colour.
The project bar on the timeline then takes the colour of the project's tag from that group — for example blue for internal projects and green for customer projects. A project carrying several tags of the group takes the colour of the first of them in the group's order (the same tag Group by files it under); a project without a tag from the group keeps the default colour. Unconfirmed projects keep their striped look on top of the colour.
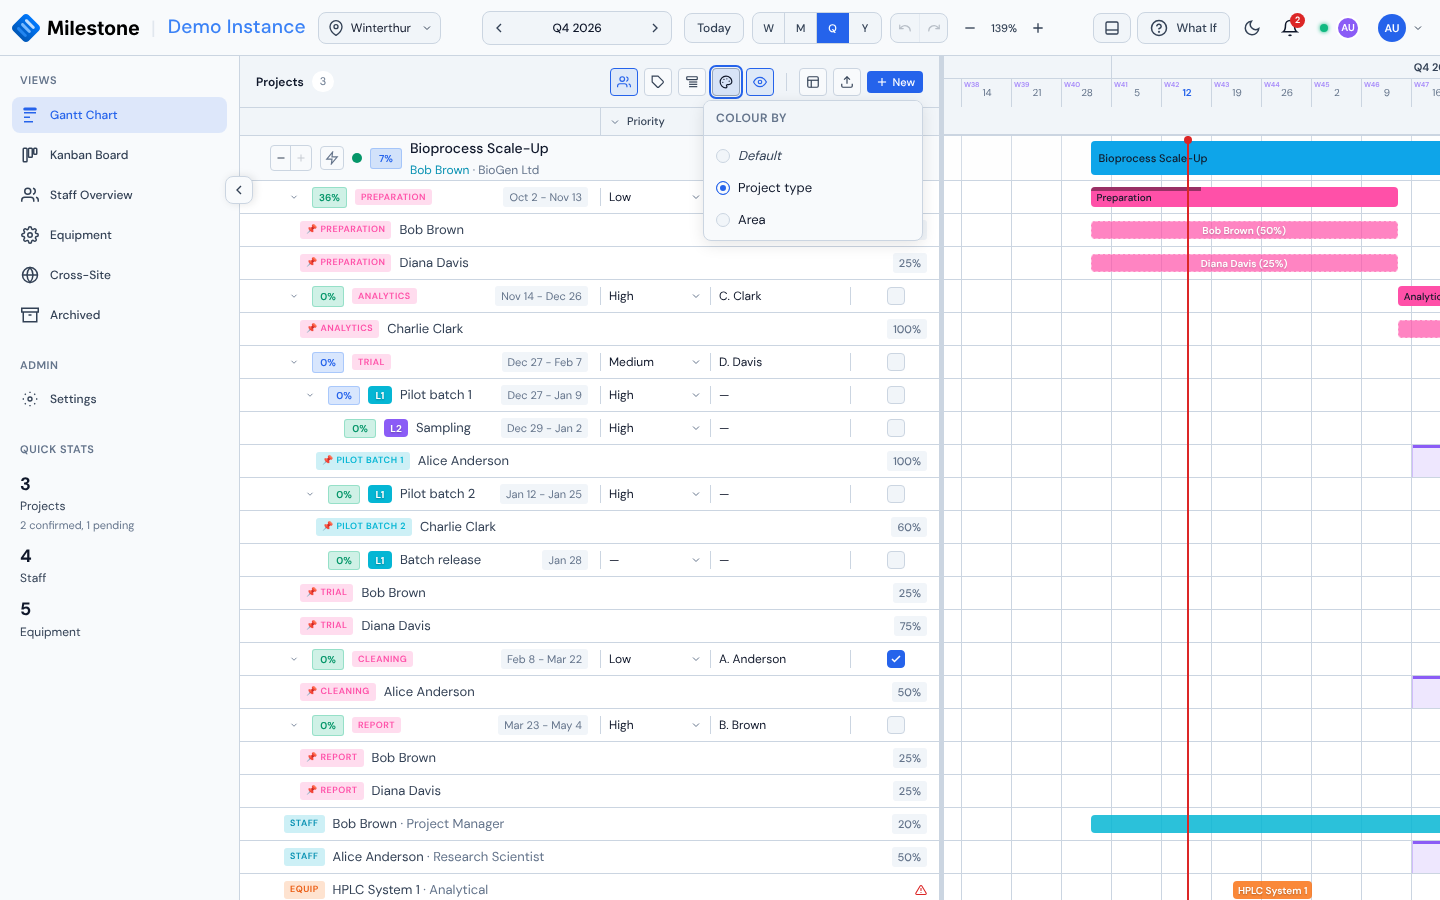
The choice is yours alone: it is remembered per site in your browser, like the tag filter, and does not change what other users see. It is independent of Group by — you can group by one group and colour by another.
Filtering projects by tag
The Tags button in the project panel header (and in the Kanban toolbar) opens a filter listed by group:
- Tick one or more tags of a group to show projects carrying any of them.
- Tick tags in several groups to show only projects matching every group.
- (No tag) in a group matches projects without a tag from that group, and combines with the group's tags.
- Clear removes the whole filter.
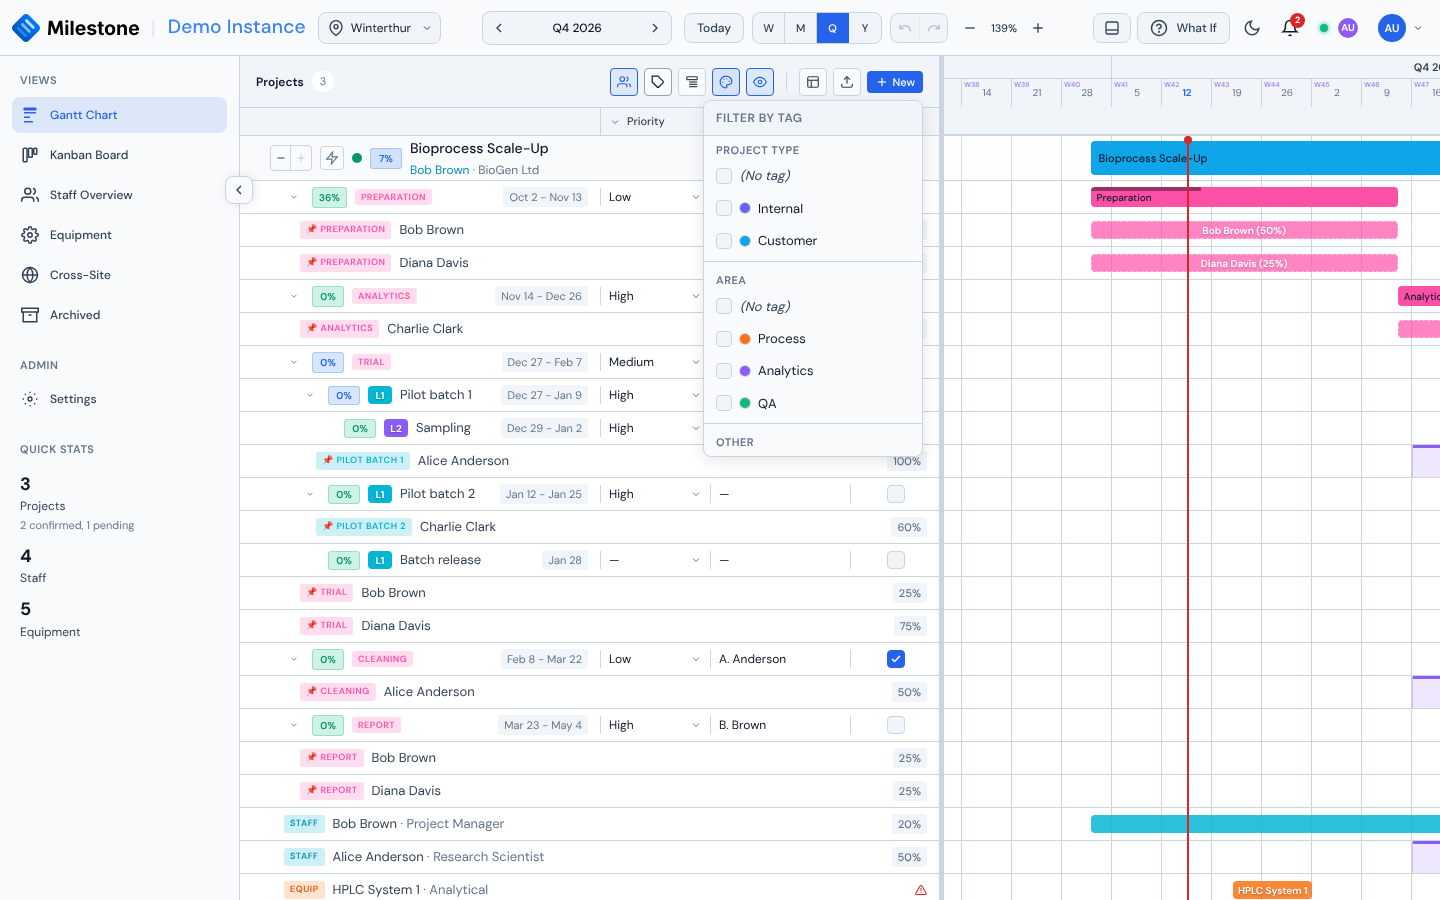
The button shows how many tags are selected, and the panel header shows x of y projects while a filter is active. The selection is remembered per site, so switching site or reloading brings it back. Tags that are deleted later are simply ignored.
Grouping projects by tag group
To see the portfolio at a glance, split the project list into sections, one per tag of a group — for example Project type → Internal / Customer:
- Click the Group by button in the project panel header (next to Tags).
- Pick a tag group. No grouping returns to the plain list.
Each section starts with a header showing the tag as a coloured pill and the number of projects in it; the timeline shows a matching band across the chart. Projects without a tag of that group are listed last under No group name. Sections without projects are left out, and a project carrying several tags of the same group is listed once, under the first of them in the group's order.
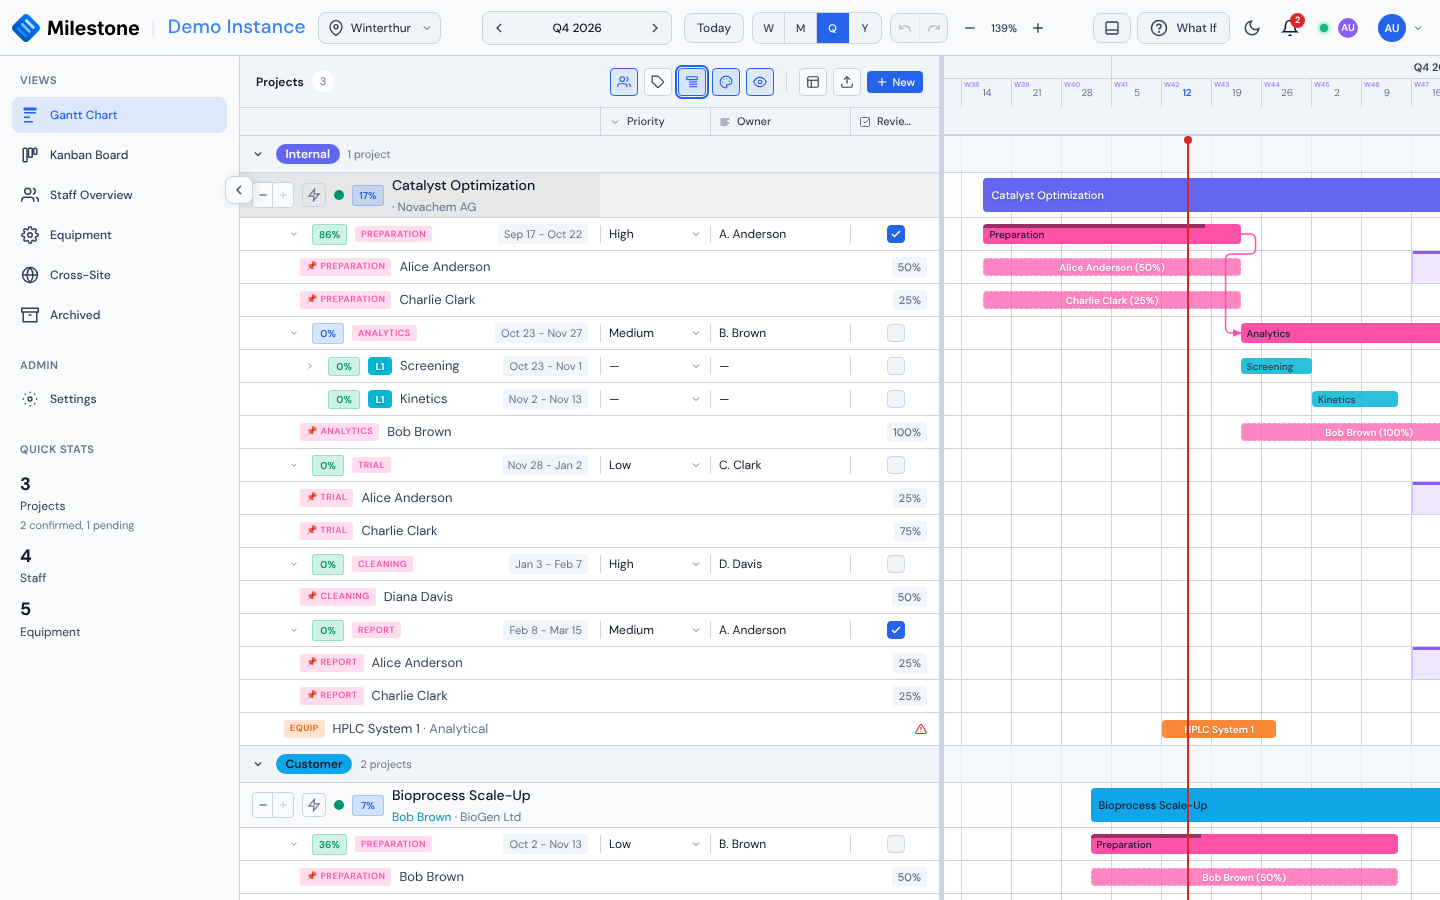
- Click a section header (or its arrow) to collapse or expand it. Collapse all / Expand all in the Group by panel act on every section at once.
- The tag filter applies first, then the grouping: sections only hold the projects that pass the filter. The header count still counts projects.
- Projects cannot be reordered by dragging while the list is grouped; choose No grouping to change the order.
- A project you create, or re-tag, into a collapsed section stays hidden until you expand that section.
- The grouping and the collapsed sections are remembered per site in your browser, like the tag filter.
Permissions
| Action | Who can do it |
|---|---|
| Attach / detach a tag | Anyone who can edit the project |
| Filter by tag | Everyone |
| Group by a tag group | Everyone |
| Colour by a tag group | Everyone |
| Create, edit, group, delete tags | Admins (Settings → Tags) |
Drag & Drop
The timeline supports direct manipulation (on projects you can edit; your own assignment bars on any project):
- Move a bar — Drag left/right to change dates (phantom preview shows target position)
- Resize a bar — Drag left/right edge to extend or shorten duration
- Reorder phases — Drag within the project panel to reorder
Touch screens
On a tablet or phone, the same gestures work with a finger: press a bar and move it to change its dates, or press one of its edges to resize it (the edge handles are wider on touch screens). A tap opens the item's dialog; a small wobble of the finger during a tap never moves or resizes a bar. A swipe that starts on a bar you can edit moves the bar, so swipe on empty row space, the project panel or the header to scroll the chart (bars you cannot edit scroll as usual). If the system interrupts a drag (an incoming call, a gesture the browser takes over), the bar returns to where it was and nothing is saved.
Completion Tracking
Each project and phase has a completion slider (0–100%):
- The filled portion of the bar represents progress
- Click on the completion area to adjust
- Purely informational — does not affect scheduling
The slider also drives the item's column on the Kanban board: 0% is To Do, 100% is Done, and anything in between is In Progress. Moving a card on the board changes the percentage here in the same way. A card you have marked Blocked keeps that status when you edit its percentage, since a number cannot express why work has stalled.
Custom Columns
Add custom data fields to the project panel to track metadata like priority, status codes, budget, or risk levels. Up to 10 columns can be active per site (including global columns).
Creating a Column
- Click Manage Columns in the panel header
- Click Add Column
- Configure:
- Column Name (required, e.g., "Priority", "Status", "Owner")
- Column Type — cannot be changed after creation:
- Text — Free-text field
- Checkbox — Boolean toggle (checked/unchecked)
- Dropdown List — Choose from predefined options
- Scope — Global (all sites) or Local (current site only)
- Column Width — 60px to 300px (default 120px), adjustable via slider
- For Dropdown type: add option values using the Add Option button (at least one required)
- Click Create
Editing Values
Custom column values appear as editable cells in the project panel, next to each project, phase, and subphase:
- Text columns: Click the cell to edit, press Enter or click away to save, Escape to cancel
- Checkbox columns: Click to toggle between checked and unchecked
- Dropdown columns: Click to open the options list, select a value or click "Clear selection" to reset
Values are saved automatically as you edit. Changes cascade — editing a phase's value also updates its child subphases. A cascade is saved as one request, so it either succeeds for the whole branch or, if saving fails, every cell it touched returns to its previous value.
Anyone signed in can edit custom-column values, including users with the plain User role. Creating, editing, reordering and deleting the columns themselves stays admin-only. Values and column changes appear for other signed-in users straight away.
Managing Columns
Open Manage Columns to see all active columns:
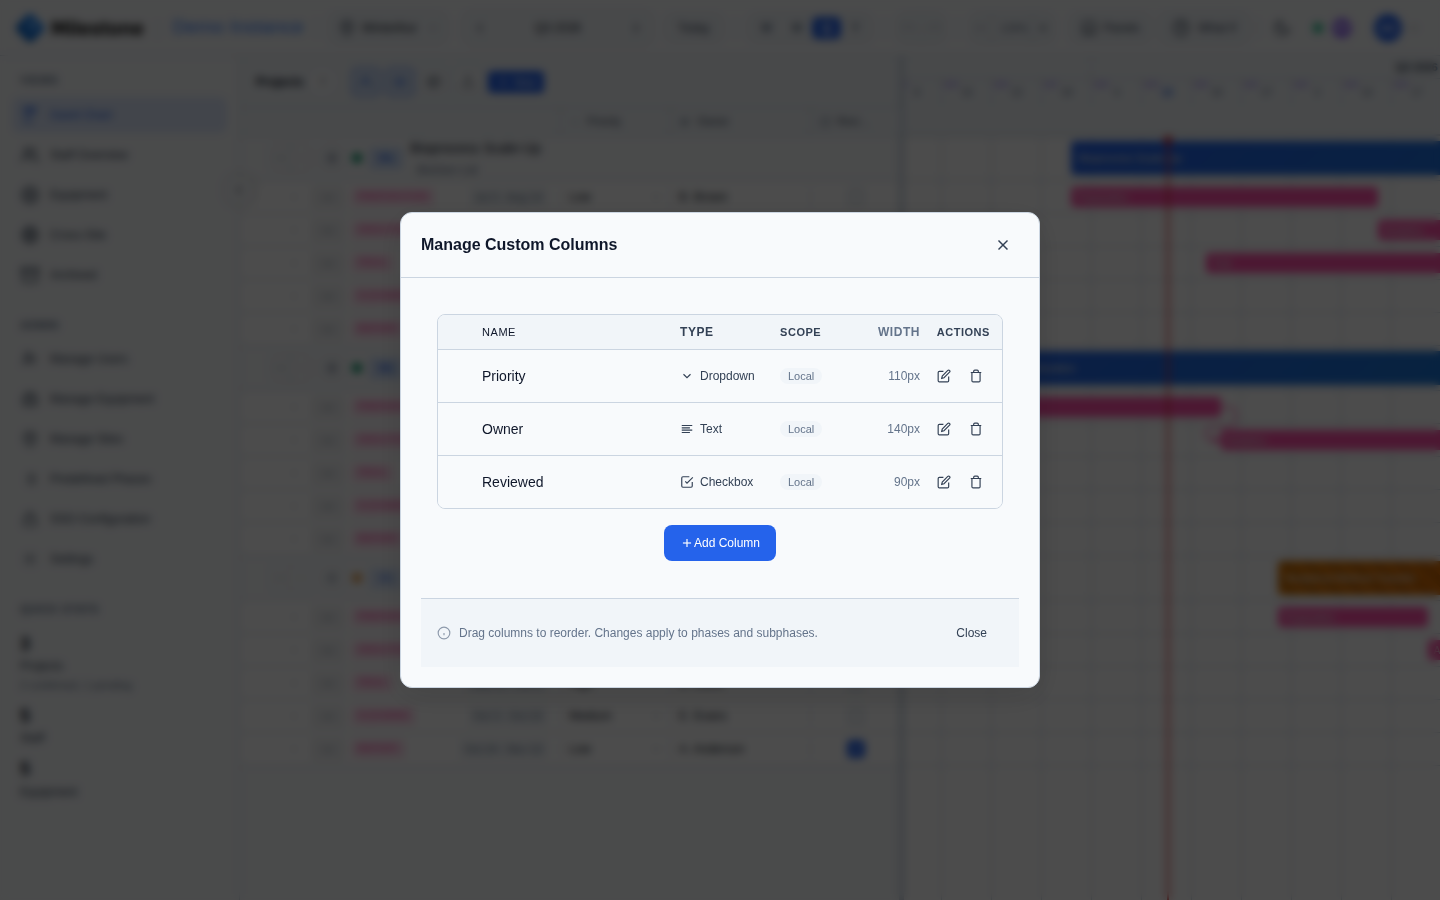
- Reorder: Drag columns by the handle icon to change display order
- Edit: Click the edit icon to change name, dropdown options, or width (type cannot be changed)
- Delete: Click the delete icon. A confirmation warns that all values will be lost
Column Filtering
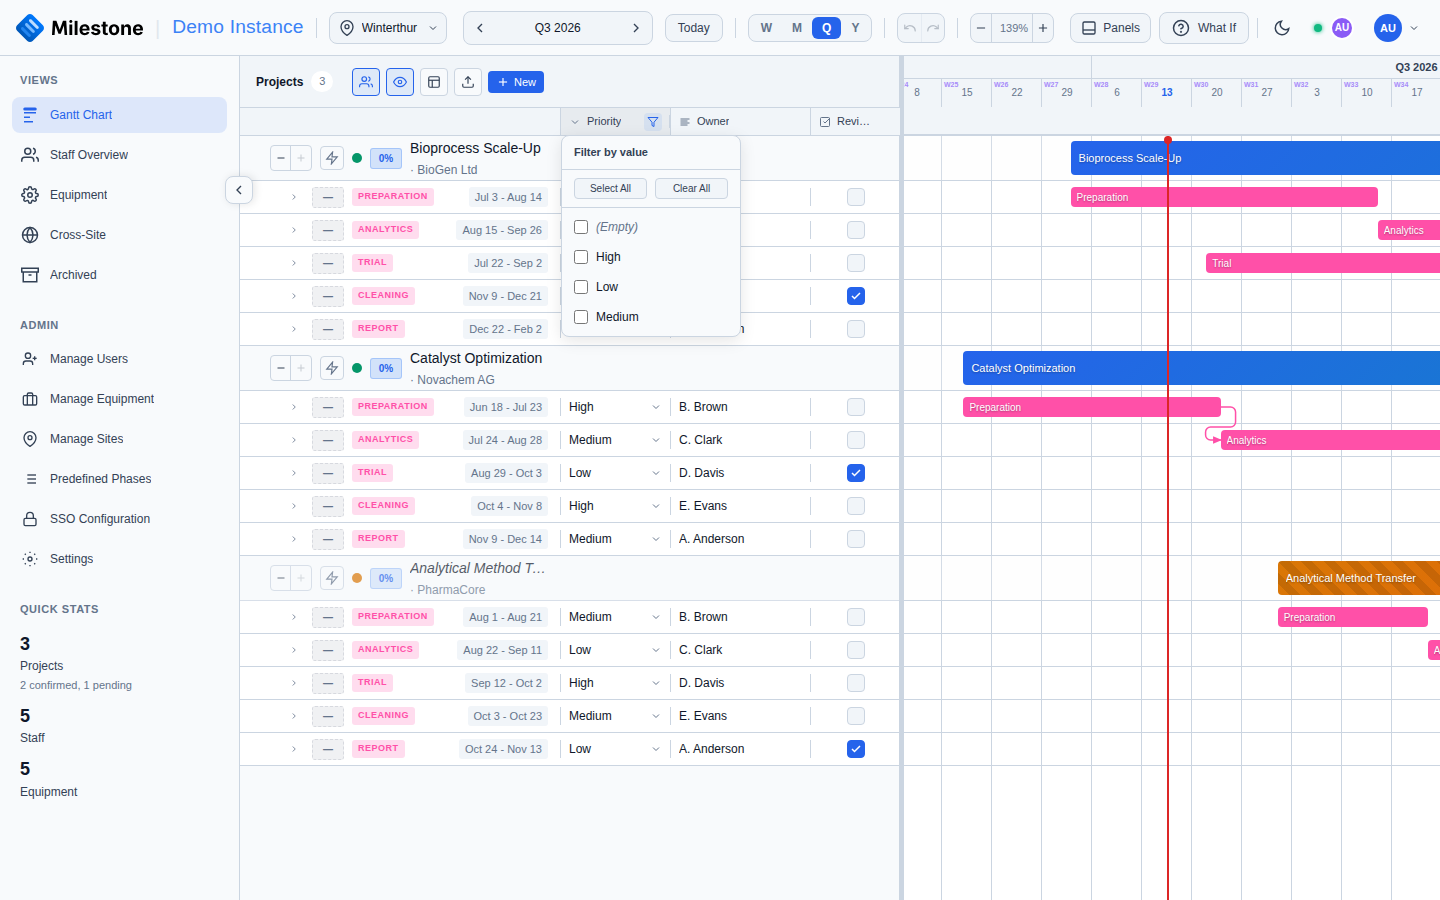
Click the filter icon on any column header to filter the project list:
- The dropdown shows all unique values in that column
- Check values to show only matching rows
- Use Select All / Clear All for quick selection
- Filter by (Empty) to find rows with no value set
- Multiple column filters combine with AND logic
An active filter turns the column header's filter icon blue.
Resizing Column Widths
Drag the right edge of any column header to resize its width (60px–400px). The new width is saved automatically.
Show/Hide Columns
Toggle individual column visibility from the column manager without deleting them.
Dependencies
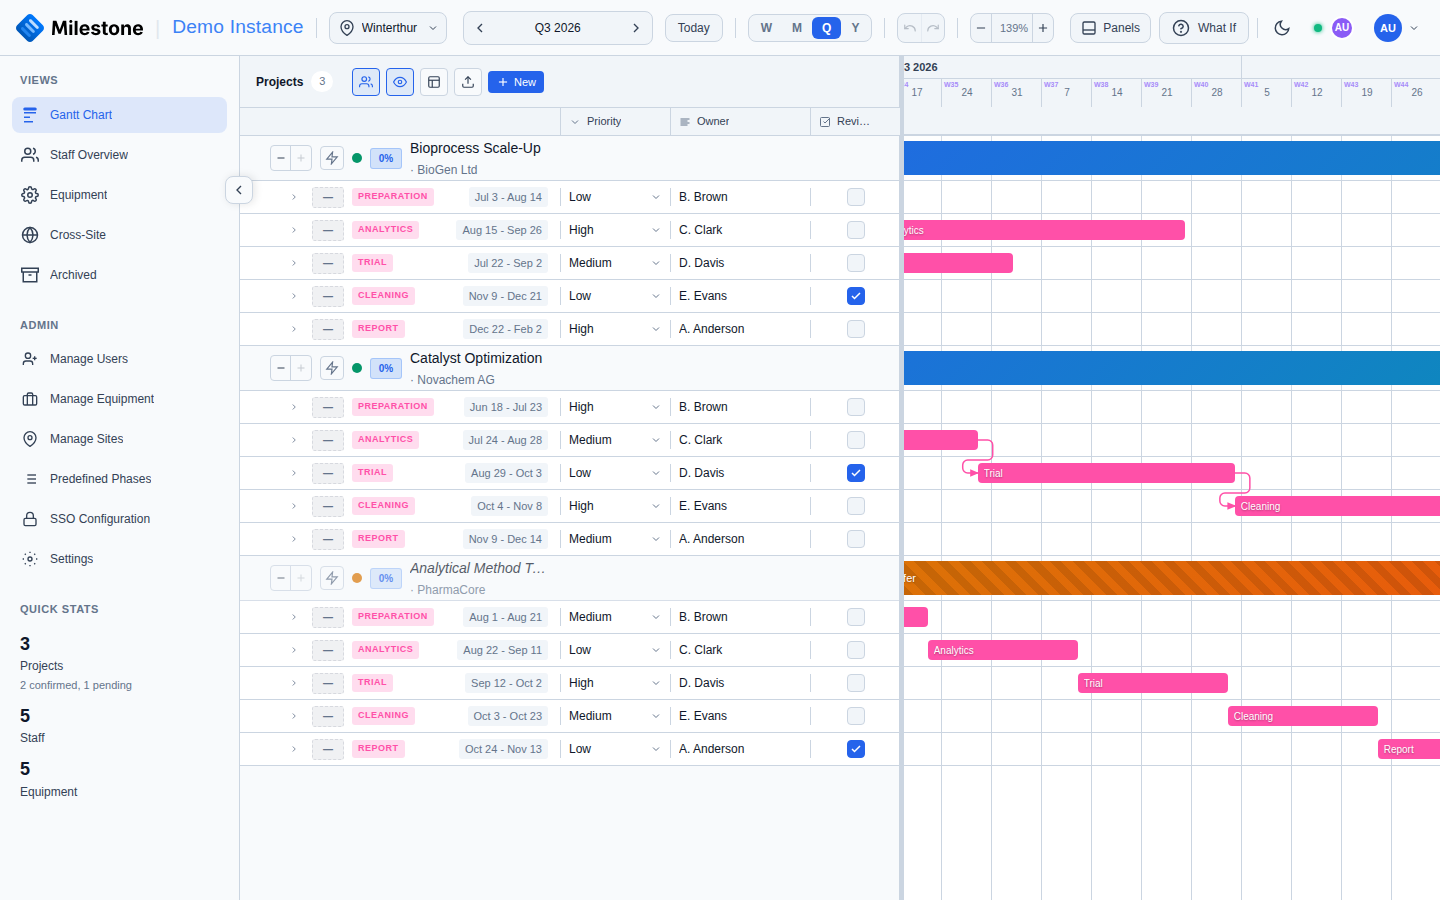
Link phases and subphases with dependency relationships to enforce scheduling logic. Dependency arrows are drawn on the timeline to visualize the relationships.
Dependency Types
| Type | Name | Meaning |
|---|---|---|
| FS | Finish-to-Start | Target starts after source finishes (most common) |
| SS | Start-to-Start | Target starts when source starts |
| FF | Finish-to-Finish | Target finishes when source finishes |
| SF | Start-to-Finish | Target finishes when source starts (rare) |
Creating a Dependency
Dependencies use a two-click flow:
- Hover over a phase or subphase bar — link zones appear at the start (left) and end (right) edges
- Click a link zone on the source item (e.g., the end zone for a Finish-to-Start link)
- Click a link zone on the target item (e.g., the start zone)
- The dependency type is determined automatically based on which zones you clicked:
- End → Start = FS, Start → Start = SS, End → End = FF, Start → End = SF
After linking, the target item's dates are automatically adjusted:
- FS: Target start moves to the day after the source ends
- SS: Target start aligns with the source start
- FF and SF: No automatic date adjustment
Child phases/subphases move along with their parent when dates are adjusted. Parent dates cascade upward to accommodate children.
Deleting a Dependency
Click the dependency arrow on the timeline and choose Delete Dependency in the popup, or edit the target phase or subphase and remove the dependency from its list. This also works for links created by older versions.
Visual Arrows
Each dependency type has a distinct visual style on the timeline:
- FS — Solid arrow from source end to target start
- SS — Dashed arrow connecting start edges
- FF — Dotted arrow connecting end edges
- SF — Dash-dot arrow from source start to target end
Constraints
- Dependencies can only be created between items within the same project
- Circular dependencies are detected and blocked — you'll see an alert if a link would create a cycle. The check follows links through phases and subphases alike, and a "shortcut" link that skips an intermediate step (A → C alongside A → B → C) is allowed, because it closes no loop
- Duplicate dependencies (same source, same type) are silently ignored
- Each link remembers whether its source is a phase or a subphase, so arrows and the critical path always attach to the right item even when a phase and a subphase happen to share the same internal id. Links created before this was recorded are read as pointing to a phase first
- Undo and Redo restore dependency links too, and save them to the server like any other change
Critical Path
The Critical Path highlights the longest sequence of dependent phases through a project, showing the minimum time needed to complete it. Items on the critical path have zero slack — any delay to them delays the entire project.
How to Use
- Click the lightning-bolt button on the project's row in the project panel (tooltip: Show Critical Path)
- Critical path items are visually highlighted on the timeline
- Click the button again to return to normal view
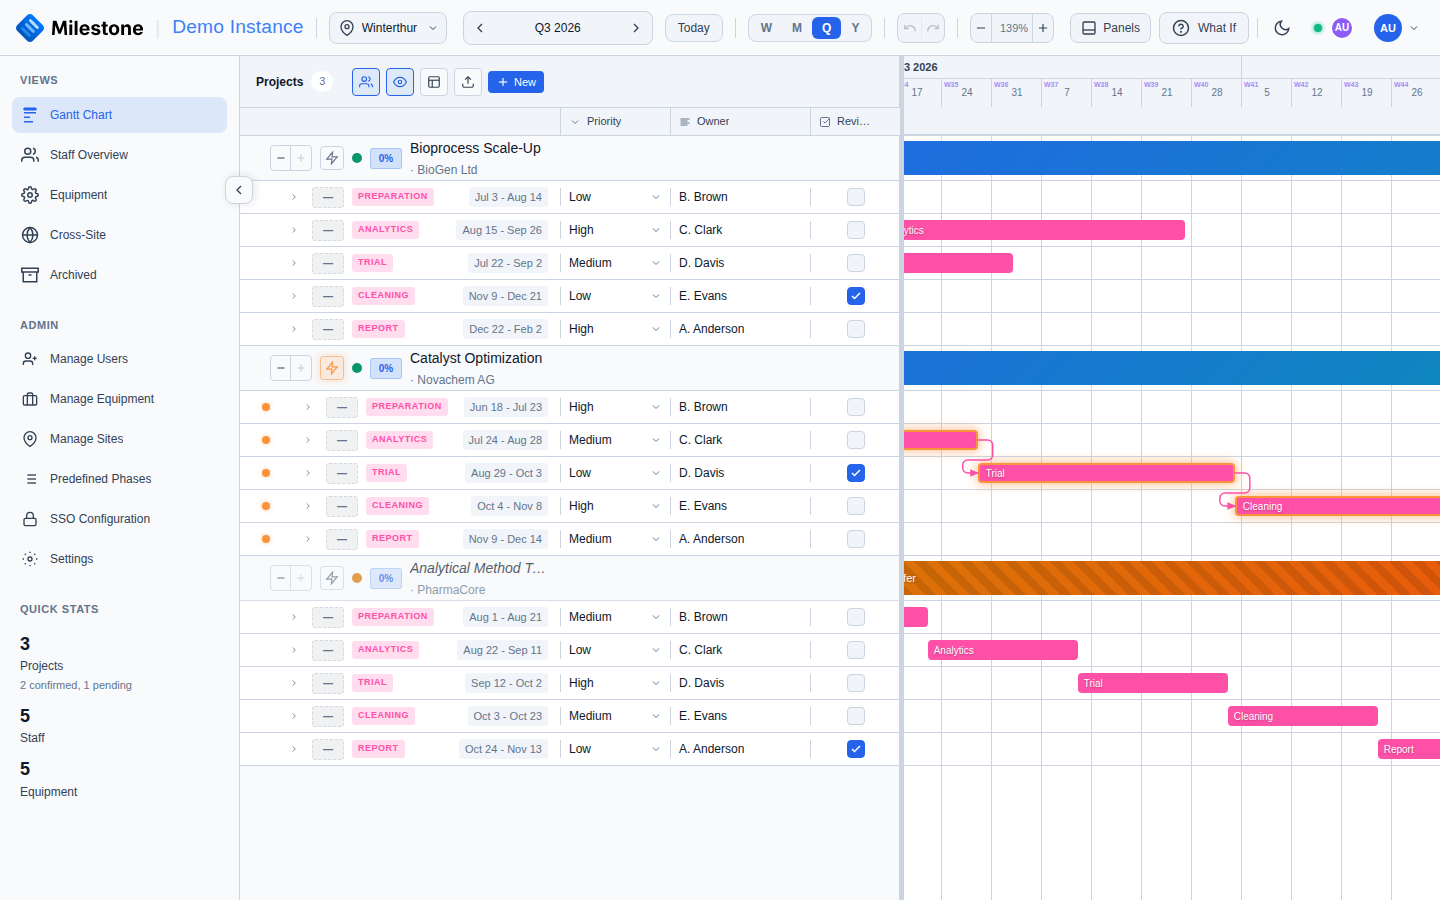
The critical path is calculated using the Critical Path Method (CPM) algorithm:
- Forward pass: calculates the earliest possible start and finish for each item
- Backward pass: calculates the latest allowable start and finish
- Items where early start equals late start (zero float) are on the critical path
- Chains in which a successor starts before its predecessor finishes (a lead or overlap) are followed to their end instead of being cut short
Tip
The critical path requires dependencies to be set up between phases. Without dependencies, all items have independent float and no critical path exists.
Context Menu
Right-click on any item for context-appropriate actions:
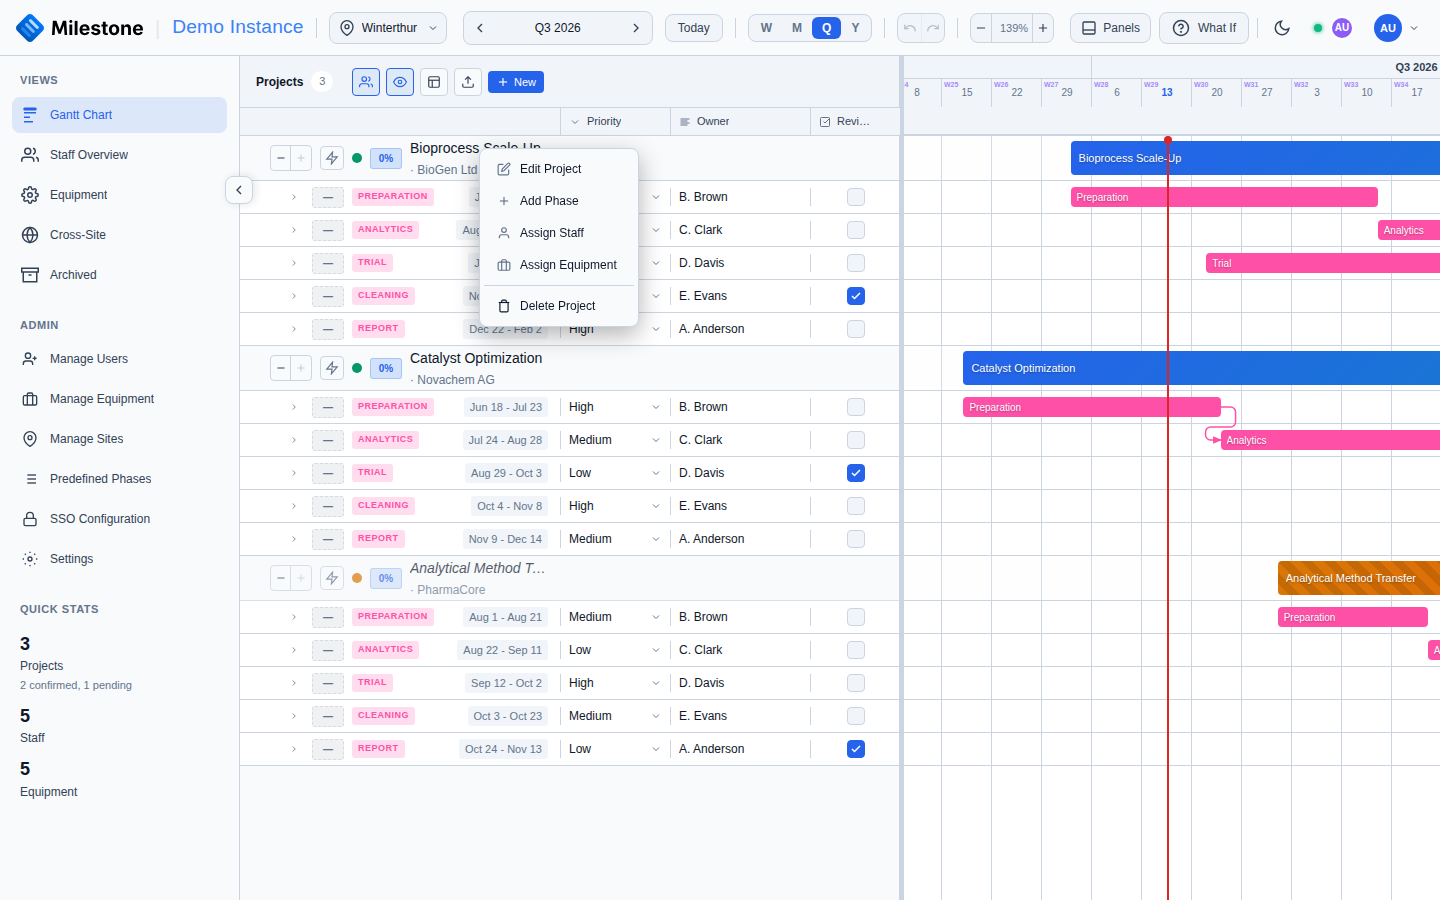
| Target | Actions |
|---|---|
| Project | Edit, Delete, Add Phase, Assign Staff, Assign me, Assign Equipment, View Details |
| Phase | Edit, Delete, Add Subphase, Assign Staff, Assign me, Assign Equipment |
| Subphase | Edit, Delete, Add Subphase, Assign Staff, Assign me, Assign Equipment |
| Staff Assignment | Edit Assignment, Remove Assignment |
| Equipment Assignment | Edit Assignment, Remove Assignment |
Actions you are not allowed to perform on that project are shown disabled. Assign me only appears for people who can't edit the project: it books your own time on the item at your maximum capacity (see Adding Yourself to a Project) and reads Assigned to me once you are on it. On your own staff assignment, Edit Assignment and Remove Assignment are available to you on any project.
Archived Projects
Completed or dormant projects can be archived so they no longer clutter the Gantt chart, without deleting their data:
- Edit the project and tick the Archived checkbox, then save.
- The project disappears from the Gantt and moves to the Archived view (sidebar).
- To restore it, open the Archived view, click the project's edit button, untick Archived, and save — it reappears on the Gantt with all phases, assignments, and history intact.
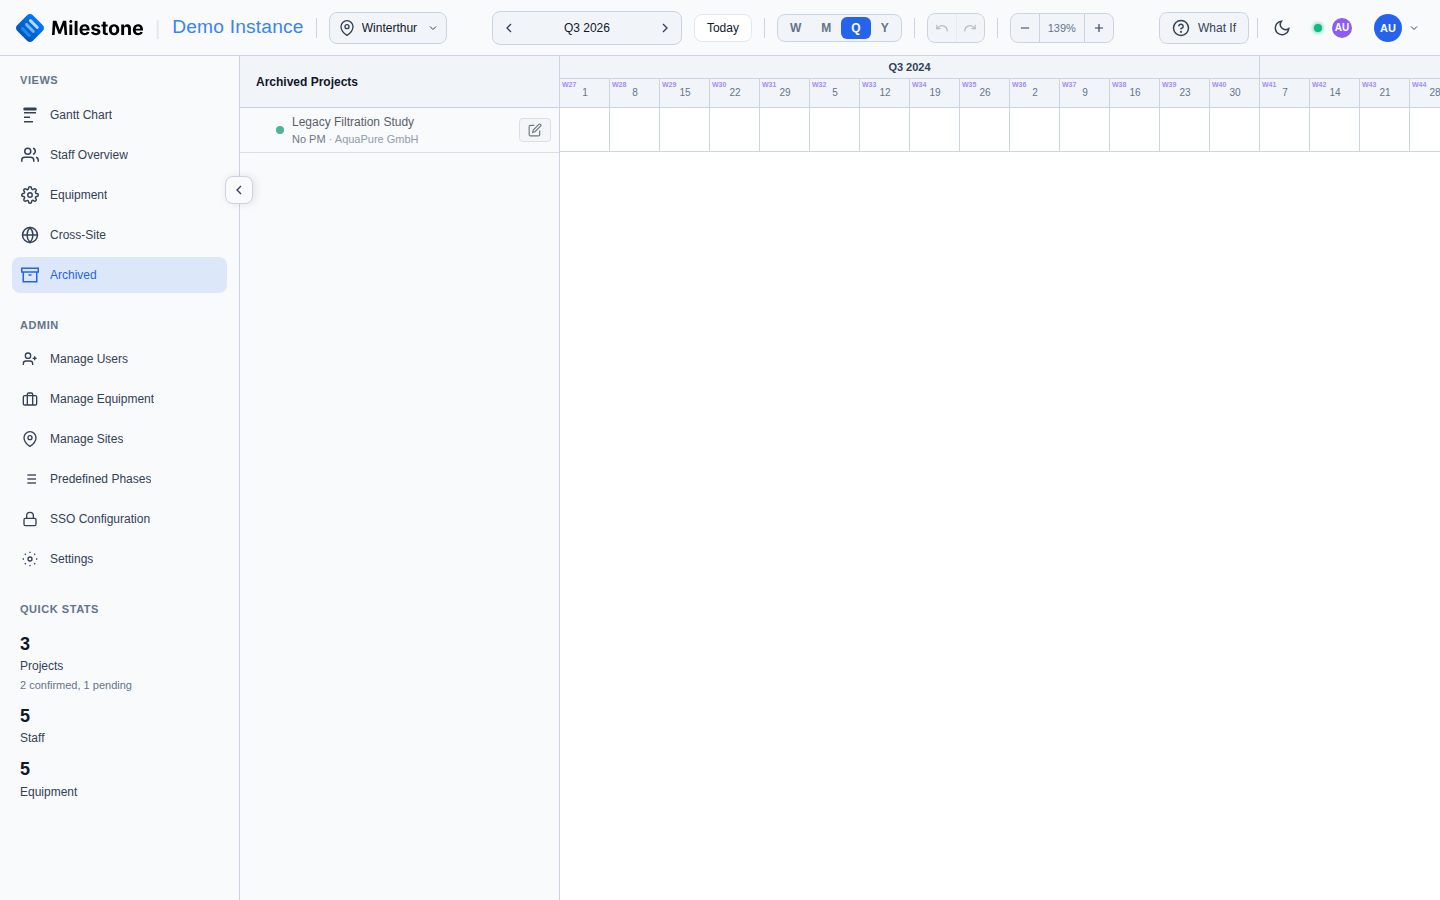
Archived projects are excluded from the Gantt chart and the cross-site overview, but they remain in the database and are included in the full site Excel export (with an Archived column).
Live Updates and the Offline Badge
Changes made by colleagues appear in your chart automatically, a moment after they save. While that live connection is down — your network dropped, the server restarted, or a proxy blocks WebSockets — an Offline badge appears in the header. Your own edits still save normally; only other people's changes stop arriving. The connection is retried automatically, and immediately when your network comes back or you switch back to the browser tab.
A drag or resize in progress is no longer interrupted when a colleague's change arrives, and text you are typing in the phase, subphase and assignment dialogs is kept.
What-If Mode on the Gantt
What-If mode is entered from the Gantt chart and stays there: while a plan is open, the other views and Settings wait until you apply or discard. In it you can move, resize, edit and delete freely; nothing is saved until you Apply. Creating new projects, phases, subphases, assignments, absences and equipment blocks is unavailable in What-If mode (the controls are disabled with an explanation). If Apply fails part-way, a banner in the header shows how many changes were applied and offers Retry, Discard and Dismiss — see What-If Planning.