Dashboards
Dashboards turn the plan into numbers and charts: how many weeks people are booked on each project, how a team's time splits between confirmed and unconfirmed work, how full each team and each instrument is, which phases are late, how many projects run at each site. A dashboard is a page of widgets — KPI tiles, gauges, bar, line and pie charts, heatmaps, treemaps, sankey diagrams and tables: nine kinds, see Chart Kinds — that anyone allowed can open, and that people who build dashboards can arrange, duplicate and share.
Open it from Dashboards in the sidebar, just below My Work. The entry needs the Dashboards permission (Superuser and User by default, see Roles & Permissions).
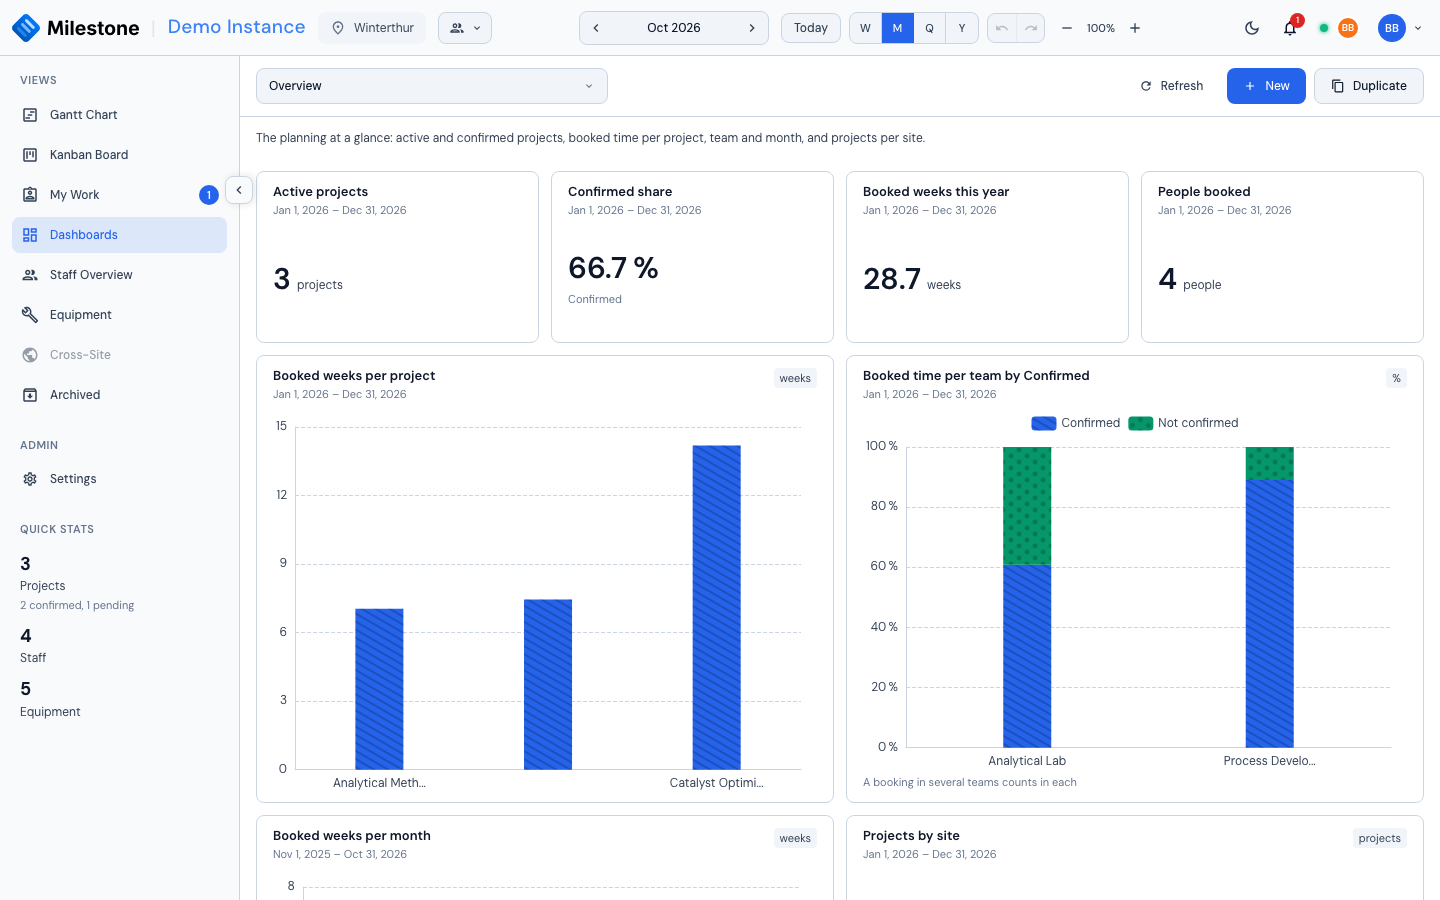
Opening a Dashboard
Dashboards in the sidebar, below Equipment, opens the view on the dashboard you looked at last. Under it the sidebar lists every dashboard you can open — click one to go straight to it; the one on screen is highlighted. The arrow at the right of the Dashboards entry folds the list away or shows it again, and Milestone remembers your choice in this browser. With the sidebar reduced to icons, only the Dashboards entry is shown.
Inside the view, the Dashboard picker at the top lists them too, in this order:
| Label | Which dashboards |
|---|---|
| Default | The Overview, shared with everyone |
| Mine | The dashboards you built, whoever you shared them with |
| Shared by name | Dashboards someone shared with you — with your role, one of your sites, one of your teams or you by name (Shared with me when the owner's account is gone) |
| Shared with no one left | Your own dashboards (and, for administrators, anyone's) shared with roles, sites, teams or people that have all been deleted since |
| Everyone | Dashboards shared with everyone who can open the view |
Type in the picker's search box to find one by name. Milestone remembers the last dashboard you opened and shows it next time.
Refresh recomputes every widget. You rarely need it: when someone changes a project, a booking, a team, a project field, an absence, a bank holiday or site closure, an equipment booking or block, the open dashboard updates by itself within a couple of seconds.
Everyone Sees Their Own Numbers
A dashboard is a set of questions, not a copy of the answers. Each viewer gets the answers for the sites they can see: a colleague who works only at Frankfurt sees Frankfurt figures on the same Overview where an administrator sees every site. Archived projects are left out unless a widget asks for them.
A widget can need a permission you do not hold — the capacity measures, a breakdown by person and the People filter need the Staff & Calendar permission — a capacity measure broken down by person or filtered to People also needs See colleagues' absences, since its days off are their absences; the equipment measures, a breakdown by equipment or equipment type and the Equipment filters need the Equipment view permission; a widget that includes archived projects needs Archived projects. Such a widget shows This widget needs the Staff & Calendar view permission (or the Equipment view permission, the Archived view permission, the Absences permission) in place of its chart; the rest of the dashboard works as usual.
The Two Built-in Dashboards
Every Milestone instance starts with two dashboards, both shared with everyone. People who build dashboards can Duplicate either one and adapt the copy. Only an administrator can change or delete them; once deleted, a built-in dashboard does not come back.
Overview
The Overview is the default dashboard (listed under Default in the picker):
| Widget | What it shows |
|---|---|
| Active projects | Projects whose dates touch this year |
| Confirmed share | The share of those projects that are confirmed |
| Booked weeks this year | Planned person-weeks on all projects this year |
| People booked | How many different people have a booking this year |
| Booked weeks per project | The ten projects with the most booked weeks this year |
| Booked time per team by Confirmed | Each team's booked time this year, split 100 % between confirmed and unconfirmed projects |
| Booked weeks per month | Booked weeks in each of the last 12 months |
| Projects by site | This year's projects per site |
Capacity and flows
Capacity and flows (listed under Everyone) shows three of the larger chart kinds on the bookings:
| Widget | What it shows |
|---|---|
| Booked weeks per team and month | A heatmap: one row per team, one column per month of the last 12 months |
| Booked weeks by site and project | A treemap: one box per site, split into its projects, this year |
| Project to team flows | A sankey: the eight projects with the most booked weeks (the rest as Other) flowing to the teams that work on them |
Neither dashboard needs a permission beyond Dashboards, so everyone who can open the view sees every tile.
With the Demo Data
A tenant seeded with the demo data — the demo tenant of the Codespaces and screenshot setups, and any tenant an administrator provisions in the admin portal with the Seed demo data option — gets the same two dashboards with a few more widgets:
- the Overview adds Share of time by Project type per team and Booked weeks by Area, over the demo's two project fields;
- Capacity and flows starts with Utilisation this quarter, a gauge of the quarter's utilisation with a target of 85 %, beside the heatmap.
The gauge's utilisation needs the Staff & Calendar permission (the User and Superuser roles hold it by default); a role without it sees the permission message on that tile and the other widgets as usual. This is why the gauge is not part of what every instance gets.
Chart Kinds
A widget is one of nine kinds. Each takes one measure and up to two dimensions (how the measure is broken down, see The Widget Editor); the editor offers only the dimensions a kind can draw and says in the preview when something is missing.
| Kind | What it shows | Dimensions | Refused measures | Options |
|---|---|---|---|---|
| KPI | One figure in large type, or the share of one value (a Bucket) | At most one, to show a share | — | Number format; the bucket for a share |
| Gauge | One figure on a dial, against a target | None | — | Target and the number format |
| Bar | One bar per value of the first dimension, split by the second | Up to two | — | Stacked or 100 % bars, horizontal or vertical, number format |
| Line | One line per value of the second dimension, along the first (usually a period) | Up to two | — | Legend, number format |
| Pie | Slices of the whole | Exactly one | Available days | Legend, number format |
| Heatmap | A grid of coloured cells: rows by one dimension, columns by the other | Exactly two | — | Number format |
| Treemap | Boxes sized by the measure: one per value of the first dimension, split by the second | One or two, no period | Utilisation, equipment utilisation, available days, people over capacity | Number format |
| Sankey | Flows from the values of the first dimension to those of the second, as wide as the measure | Exactly two, no period | Utilisation, equipment utilisation, available days, people over capacity | Number format |
| Table | The figures as rows and columns | Up to two | — | Number format |
- Gauge: the dial runs from 0 (lower when the value is negative, as available days can be) to a little past the value and the target. With a Target, the scale is green up to the target, amber from the target up to 100 % (for a percentage) or up to 15 % above the target (for days, weeks or counts), and red beyond; the bar showing the value takes the colour of its band, and Target 85 % is written under the figure, in the widget's number format like the figure itself (Target 20 days with Integer). A target of 100 % or more leaves no amber band: a value right at such a target is already red. Without a target the dial has one colour
- Heatmap: when one of the two dimensions is a Period, the periods are the columns; otherwise the first dimension gives the rows and the second the columns. A colour scale under the grid gives the values; each cell shows its figure when the cells are wide and tall enough. An empty cell means no data for that pair (a utilisation with no capacity there), not zero
- Treemap and Sankey add their values up, so they refuse the four measures that cannot be added (two percentages, available days, which can be negative, and people over capacity), and the Period dimension is not offered. With Top N, the values beyond the N largest of the first dimension become one Other box or node
- A chart with nothing to draw for its period reads Nothing to show for this period
What the Numbers Mean
Booked time is planned time — what the bookings in the Gantt chart say, not hours recorded afterwards. The Measures below say what each measure counts; these rules hold for all of them.
- A working day is Monday to Friday, except the bank holidays of a site. Booked time counts the working days of the project's site; capacity counts those of the person's sites and equipment availability those of the equipment's sites
- A booking on a phase or subphase counts only inside its card's dates; a booking on the whole project counts over its own dates. Someone booked both on the project and on one of its phases counts twice, as in the Staff & Calendar view
- Bookings waiting for approval are not counted until they are approved
- Counts of projects and phases take those whose dates touch the period (in every month, quarter or year they touch, when broken down by period)
- A breakdown by Team uses the teams of the booked person at the project's site (someone in two teams counts in both; No team otherwise). Project team uses the teams the project belongs to
- A project with two tags, or two items of a multi-select field, appears under each of them; the total counts it once. The widget then says so under its chart. The same goes for a person or an instrument at two sites in a breakdown by Site
- Empty values have their own bucket: No customer, No manager, No tag, No team, No site, No phase (a booking on the whole project), No type (equipment), Not set (a project field)
- A value that cannot be computed — a utilisation with booked time but no capacity in that bucket — shows –, never 0
Measures
The Measure list of the widget editor is grouped by family. Each family has its own filters and breakdowns: the editor offers only those that apply.
Bookings
| Measure | What it counts |
|---|---|
| Booked days | For each booking, its allocation times the working days it covers inside the period. A booking at 50 % over two working weeks counts 5 days |
| Booked weeks | Booked days divided by 5 |
| Bookings | Booking rows |
| People booked | Different people with a booking |
Capacity
Needs the Staff & Calendar permission. A breakdown by Person and the People filter also need See colleagues' absences (a person's capacity shows the days they are absent); by site, team or period the figures add people up and need the Staff & Calendar permission alone.
| Measure | What it counts |
|---|---|
| Capacity (days) | The days the bookable people can work, at their max capacity: a person at 60 % has 3 days in a full week |
| Available days | Capacity minus booked days. Negative when someone is booked beyond their capacity |
| Utilisation | Booked days over capacity, in %. Over 100 % means booked beyond capacity |
| People over capacity | Different people whose booked days in the period (or in the bar, line point or cell) are more than their capacity |
- Who counts: every active person marked Bookable as a resource who is a member of one of your sites. Bookings of people no longer bookable, or deactivated, are left out on both sides
- Capacity is the weekdays at their sites minus the bank holidays of those sites, their absences of a type that counts as unavailable (a recurring absence only on its weekdays; Home Office leaves them plannable) and the site closures that apply to them — the same closures the Staff & Calendar view shows
- Sites and teams are the person's: a breakdown by Site or Team, and the Sites, Teams and People filters, use the person's sites and teams on both sides of the ratio, not the project's. A person at two sites appears under each and once in the total
- The team figure is weighted: a team's utilisation is the team's booked days over the team's capacity, not the average of its members' percentages. A KPI without a breakdown is the weighted figure of everyone in scope
- A bar, line point or cell with booked time and no capacity (everyone off that week) shows –; with neither, 0 %
- Archived projects: bookings on archived projects are left out unless the widget includes them
- Booked time is counted only on projects at your sites: a person you see whose bookings are on a project at a site you cannot see shows less booked time than they have
- Not the same as the Staff & Calendar view: its heatmap shows each day and does not take bank holidays off, while capacity does, and booked days follow the project's site while capacity follows the person's. A person booked on a project at a site with other bank holidays can read slightly over or under 100 %
Projects
| Measure | What it counts |
|---|---|
| Projects | Projects whose dates touch the period |
| Project weeks | The working weeks a project lasts inside the period, whoever is booked |
| Project volume | The projects' Volume field, added up |
Phases
| Measure | What it counts |
|---|---|
| Phases | Phases whose dates touch the period |
| Phase weeks | The working weeks a phase lasts inside the period |
| Phases due | Phases whose end date lies in the period (a milestone: its date), each filed once, in the month, quarter or year it is due — and the milestones below a phase, at any depth |
| Phases overdue | Phases and milestones due before today that are not Done, filed by their end date |
- Phases and Phase weeks count top-level phases; Phases due and Phases overdue also count milestones below a phase (a milestone subphase of any depth, on its date, under the type of the phase it sits in)
- Break them down by Status (To do, In progress, Blocked, Done — the Kanban columns) or by Phase
- The Milestones filter includes milestones (the default), shows only milestones, or leaves them out. On Phases due and Phases overdue, only counts the milestones at every level; on Phases and Phase weeks, the milestone phases
Equipment
Needs the Equipment view permission.
| Measure | What it counts |
|---|---|
| Equipment booked days | The working days of each equipment booking inside the period, at the project's site (a booking is a whole day, there is no allocation) |
| Equipment bookings | Equipment booking rows |
| Equipment booked | Different instruments with a booking |
| Equipment utilisation | Booked days over the instrument's availability, in % |
- Availability is the weekdays at the equipment's sites minus the bank holidays of those sites and its blocks, for every active instrument at one of your sites
- Overlapping bookings add up: two projects booking the same instrument the same week count twice, so utilisation over 100 % flags a conflict. A booking inside a block counts in full too — it is the same conflict
- Equipment utilisation is broken down by Equipment, Equipment type, Site (the equipment's sites, like its Sites filter) or Period; the other equipment measures take the project breakdowns and filters as well
- Booked days follow the project's site and availability the equipment's: a booking from a site with other bank holidays can read slightly over or under 100 %
- Inactive equipment counts in booked days and bookings, not in utilisation
- Booked time is counted only on projects at your sites, like capacity: an instrument at your site that a project at a site you cannot see has booked reads lower utilisation for you than for someone who sees both sites
Periods
This year, Last year, Next year, This quarter, Last quarter, Next quarter, This month, Last month, Next month, Last 12 months, Next 12 months and All time, or a custom range. Quarters and months are calendar ones. Last 12 months and Next 12 months both include the current month: the last 12 end with it, the next 12 start with it.
Building a Dashboard
Building dashboards needs the Manage dashboards permission (Superuser by default). The buttons beside the picker:
| Button | What it does |
|---|---|
| New | Asks for a name, an optional description and who sees it, then opens the empty dashboard for editing |
| Duplicate | Copies the open dashboard as a private Copy of … and opens it for editing |
| Edit | Lets you rename the dashboard, change its description and move, resize, add, change and remove widgets (your own dashboards; administrators: any) |
| Share… | Changes who sees it |
| Delete | Deletes the dashboard and its widgets, after a confirmation |
Editing the Layout
While you edit, the toolbar shows Undo, Redo, Add widget, Save and Cancel, and the status beside the picker reads Editing — Editing — unsaved changes once you change something.
- Rename the dashboard and change its description in the two fields above the widgets (Name is required, up to 100 characters; the description up to 2000). Clearing the name and clicking Save shows Enter a name and saves nothing
- Move a widget by dragging its header
- Resize it from its bottom-right corner: making it wider or narrower trades width with the widgets beside it in its row, so the row stays full (no widget gets narrower than two columns); making it taller pushes the rows below down
- The edit and remove icons in a widget's header open it in the widget editor or take it off the dashboard
Undo and Redo (or Ctrl/Cmd + Z and Ctrl/Cmd + Y / Ctrl/Cmd + Shift + Z, outside the Name and Description fields) step back and forth through your moves, resizes, added, changed and removed widgets and renames — up to 50 steps — until you save or cancel; the header's Undo and Redo belong to the Gantt chart and are not shown on this view.
Nothing is saved until you click Save. Cancel, choosing another dashboard or leaving the view asks before discarding your changes. A dashboard holds up to 50 widgets.
On a phone (640 px wide or less) dashboards are view-only.
The Widget Editor
Add widget (or a widget's edit icon) opens the editor. A live preview on the right shows the real result as you change the settings.
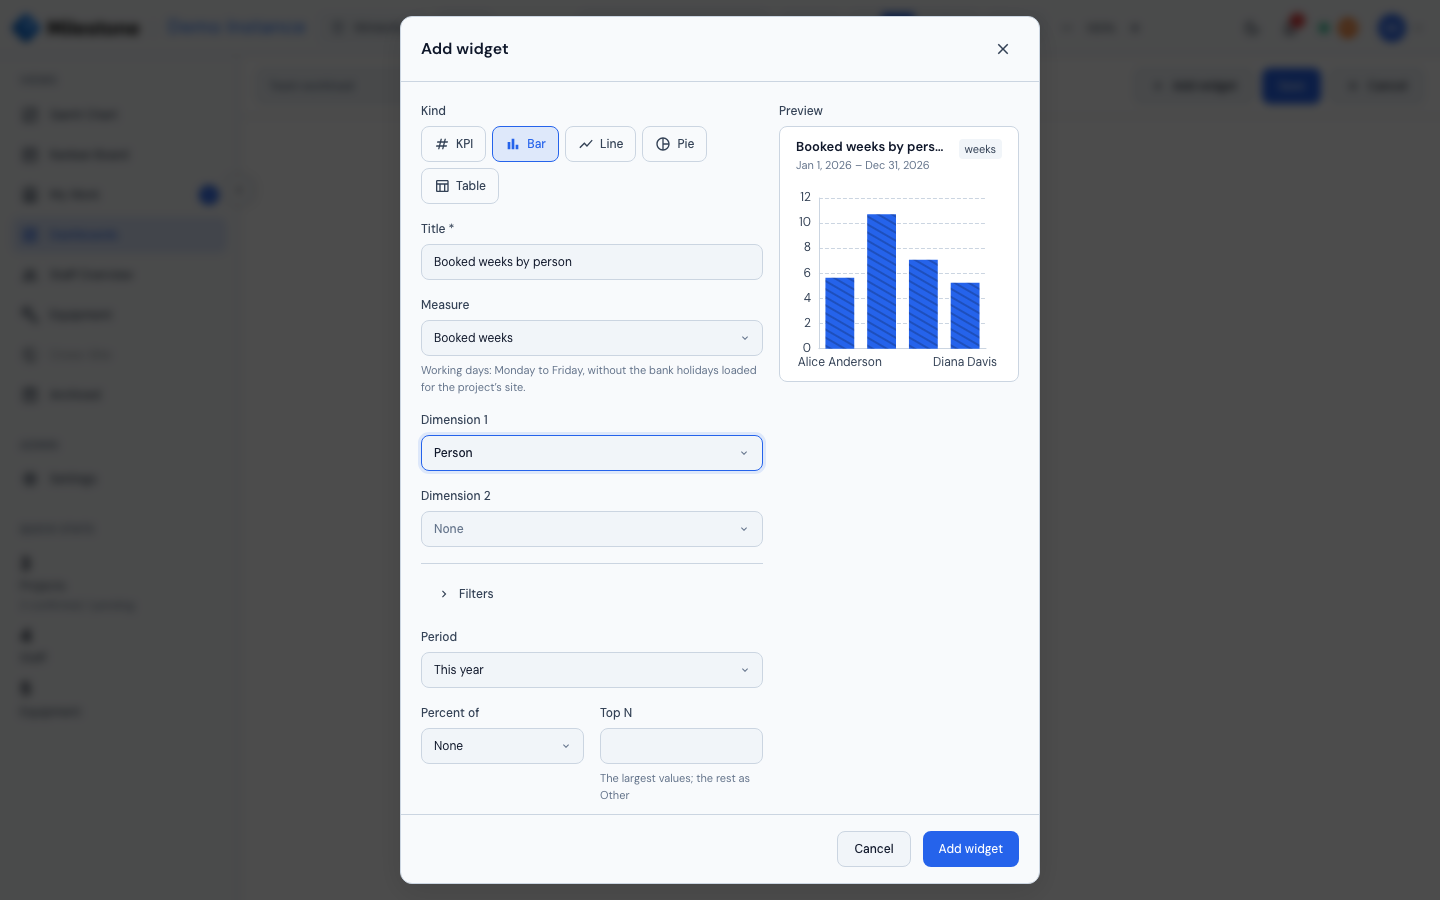
- Kind — KPI, Gauge, Bar, Line, Pie, Heatmap, Treemap, Sankey or Table (see Chart Kinds). A gauge has no dimensions; a heatmap and a sankey need two, and the second dimension field opens once the first is chosen
- Title
- Measure — grouped by family: Bookings, Projects, Phases, Capacity and Equipment (see Measures). The capacity measures are listed only with the Staff & Calendar permission, the equipment measures only with the Equipment view permission. A hint under the list says how the measure counts its days
- Dimension 1 and Dimension 2 — how to break the measure down: Site, Team, Project team, Person, Project, Project manager, Customer, Confirmed, Tag, Phase, Status, Equipment, Equipment type, any dropdown or toggle project field, or Period (by year, quarter, month or week). Only the dimensions that make sense for the measure are offered; a pie takes one dimension, a KPI at most one, a heatmap and a sankey two, a treemap one or two (no Period for treemaps and sankeys), a gauge none
- Filters — only those of the measure's family: sites, teams, project teams, people, projects, tags, field items, confirmed or unconfirmed projects, archived projects for bookings; the same without teams and people for projects, plus Milestones for phases; Sites, Teams and People (the person's) for capacity; the project filters plus Equipment and Equipment types for the equipment measures (Sites, Equipment and Equipment types only for equipment utilisation). Changing the measure drops the filters the new one does not take
- Period — one of the twelve periods or a custom range
- Percent of — show shares instead of amounts: of the total, or within each value of the first dimension (each bar adds up to 100 %). Not offered for Utilisation, Equipment utilisation (already percentages), Available days (which can be negative) and People over capacity (counted again in each bar, so the bars are not parts of the total); a KPI of these four shows its figure for the whole period, with no dimension. A treemap or a sankey offers only the share of the total: within each value of the first dimension, every box or left node would add up to 100 % and be drawn the same size. A gauge, which has no dimension, offers neither Percent of nor Top N
- Top N — keep the largest values and group the rest as Other (on a heatmap, treemap or sankey, Other is a row, a box or a node)
- Options — stacked or 100 % bars and their orientation (no stacked or 100 % bars of the four measures without a percentage: a stack of percentages or of negative days adds up to nothing), a legend for lines and pies, the number format. A KPI showing a share needs a Bucket: the value whose share it shows (for example Confirmed). A gauge takes a Target in the measure's unit (the hint under the field says which: In %, In weeks, …); leave it empty for no target. Only a number from 0 to 1 000 000 000 is kept (
85,12,5); any other text — a negative number, letters — saves the widget without a target, never with the one typed before
A pie of Available days is refused (negative days cannot be slices), and so is a treemap or sankey of the four measures that cannot be added up. If the combination cannot be answered, the preview says why in plain words, and Add widget / Save Changes waits until you fix it. A new widget is placed below the others; arrange it on the grid afterwards.
Sharing
Share… (and New) set who sees a dashboard:
| Visibility | Who sees it |
|---|---|
| Private | You (and administrators) |
| Shared with… | The people you choose below — anyone who matches one of them sees it |
| Everyone | Everyone who can open the Dashboards view |
With Shared with…, the dialog lists four kinds of target, and you can mix them freely:
| Target | Who it reaches |
|---|---|
| Roles | Everyone holding one of the roles you tick |
| Sites | The members of the site — the people whose user account lists it. Someone who sees every site (an administrator, or a role allowed to see all sites) but is not a member of that site is not reached this way |
| Teams | The members of the team (the team's site is shown beside its name; an inactive team is marked (inactive)) |
| People | The people you name — any active person at your sites, and anyone who sees every site |
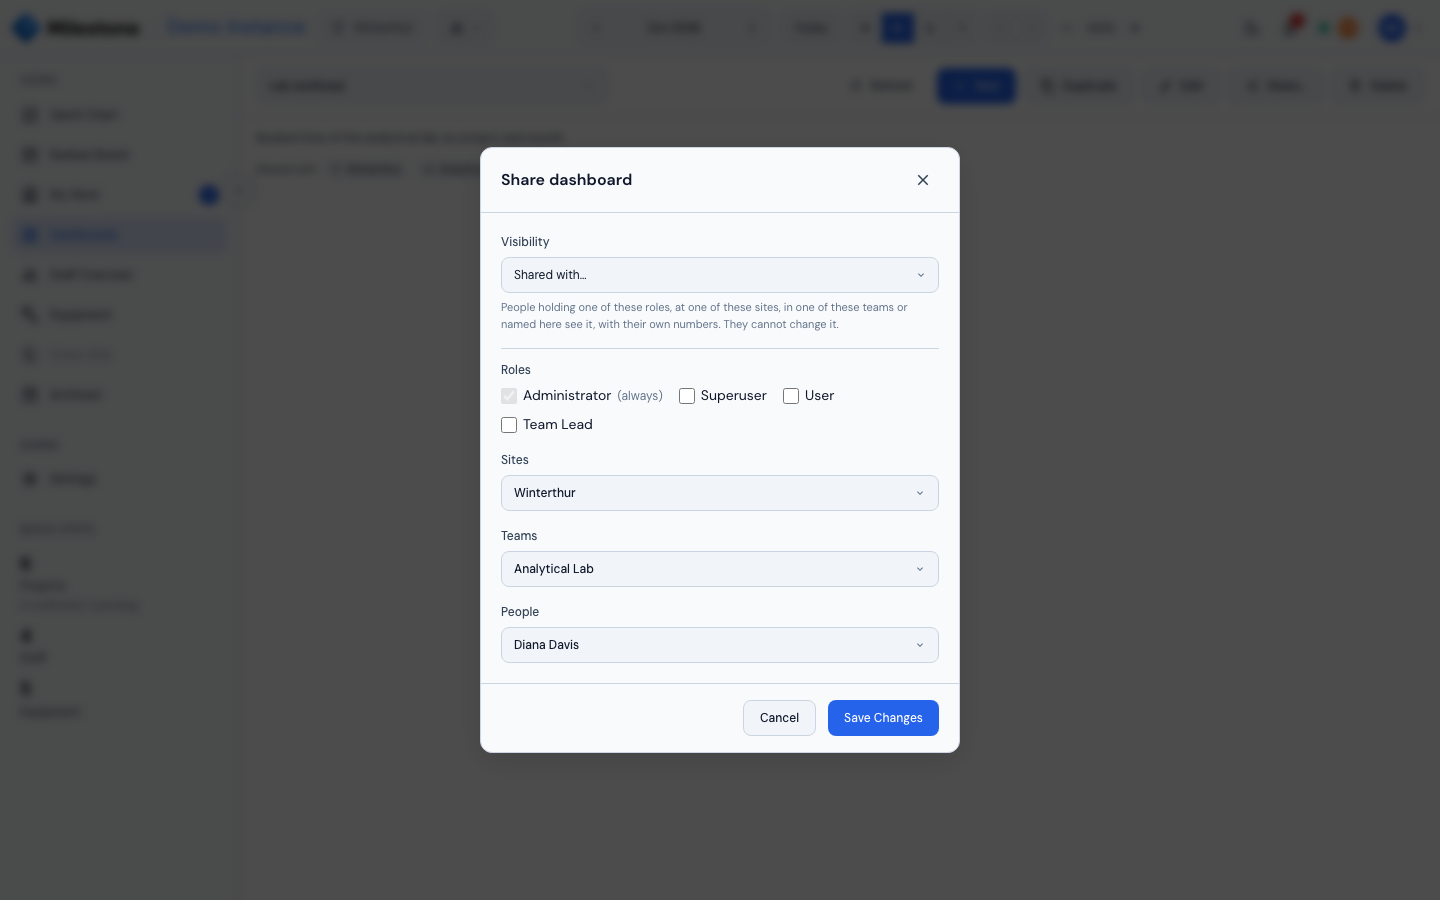
Choose at least one target; with none, the dialog shows Choose at least one role, site, team or person. Sharing is view only: the people you share with open the dashboard and see their own numbers, but only you (and administrators) can edit, share or delete it.
Under the dashboard's title, the Shared with line names who sees it — one chip per role, site, team (Team · Site) and person — or reads Shared with everyone, or Only you (and administrators) for a private one. Everyone who can open the dashboard sees that line, with every name on it — including sites, teams and people outside their own sites: the owner chose to share with them, and the line shows names only, never planning data.
A role, site, team or person you shared with that is deleted drops off the dashboard by itself. When every target is gone, the dashboard reads Shared with no one left and only you and the administrators see it. A target you can no longer pick — a person who was deactivated, a site you no longer belong to, a team at such a site — stays on the dashboard, and keeps its access, until you remove it in Share…, where it is marked No longer among your choices.
The sharing changes only through Share…: saving widgets, the name or the description in edit mode never touches it, so a change someone else made in Share… meanwhile is kept, and a target deleted while you were editing never blocks your save.
People reached through a role, site, team or name still need the Dashboards permission to open the view. A custom role does not get it automatically: an administrator allows it in Settings → Roles.
When two people edit the same dashboard at once, the last one to save wins.
Limits
- A period covers at most five years. All time runs from the first to the last project in scope; when that is longer than five years it ends at most a year from today and the widget says Period cut to five years. All time spans the projects' dates at your sites: a booking placed outside its project's dates is counted only by a period that covers it
- Bank holidays count only for the years an administrator loaded for the site (see Bank Holidays); in a year without holidays every weekday is a working day
- Bookings waiting for approval are never counted
- "Today" and "this year" follow the server's date (UTC)
- The People filter lists the people of the site selected in the header, although a dashboard covers every site you can see
- A gauge has no dimensions, a heatmap and a sankey exactly two, a treemap one or two; widgets built through the API outside these rules are still drawn (a one-dimension heatmap as a single column, for example)
What-If Mode
The Dashboards entry is disabled while a What-If plan is open: dashboards always show the saved plan. Apply or discard the plan first.